
This is the first of a series on the question of data availability, structure, value and challenges.
The “curse of dimensionality”. Sounds daunting, doesn’t it? As previously discussed in our post on Biomarkers as the Guideposts for Drug Discovery and Development, this “curse” is a common problem in enabling precision medicine.[1] The term refers to a phenomenon when the number of measured variables (such as gene expression levels) is much greater than the number of available samples or patients. In that situation, the possible space of observations is vastly greater than the available data – raising the risk that any patterns discovered in the data occur only by chance. Ironically, as the ease of generating large molecular datasets in biology research increases, it becomes much harder to glean reliable insights from the data – things like the identification of new drug targets, or factors that result in positive patient prognosis.
Not All Data are Created Equal
High-throughput molecular data, often termed ‘omics’ data as a catch-all, includes genomic, proteomic, transcriptomic and other types of data which hone in on a person’s biology. Omics comes from the Greek meaning “a totality of” – proteomics, for instance, is data about all the proteins available in the human body. Beginning with the onset of the genomics revolution, when the first non-human genome was sequenced in 1976 and expanding still further with the Human Genome Project, a fifteen year project which published its final chromosome reference sequence in 2006, the ability to delve deeper into biological data has put us on a track to being overwhelmed by the data, particularly as the cost of omics data generation continues to rapidly fall.[2]
However, more data doesn’t guarantee better research insights or patient outcomes. The challenge lies in the proper interpretation of the biology or pathology represented by the high dimensional data.
While there are many diseases that can be traced back to a single genetic or physiologic abnormality (such as the HTT gene in Huntington’s Disease or BCR-ABL translocation in Chronic Myelogenous Leukemia), it is more common to see diseases that result from the complicated interaction of many genetic, physiologic, and environmental factors. This is reflected in the difficulty in developing successful therapeutic approaches for diseases like lupus, Alzheimer’s, or ALS. In these diseases, individual factors can have very limited effect. Only when multiple factors combine does a perfect storm arise, causing disease or deterioration. However, when two or more factors are believed to interact synergistically, parsing the massive number of possible omics combinations is extremely challenging. Testing all possible synergies requires both a massive amount of computing power and robust algorithms which can analyze the data without finding spurious relationships by chance.[3] It’s the curse of dimensionality rearing its ugly head again.
Sifting Through
If finding the true factors driving disease is so difficult given the curse of dimensionality, what can we do? One approach for working effectively with large scale data is creating a “network model”; that is to say, a graphical representation of the hierarchical relationships between the data. A network model shows how “downstream” variables can summarize the information contained in other, “upstream” data – which means that the downstream network variables are the ones that matter most. When sifting through large scale 'omics data, because network models are designed to show how different variables interact, they allow for easy interpretation of the key molecular or laboratory factors driving clinical disease. This makes graphical network models a powerful tool for addressing the curse of dimensionality and identifying reliable insights into disease.
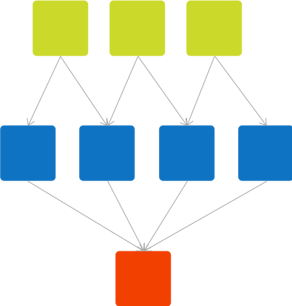
Causal networks create a transparent map pointing toward the relationship between data and outcomes. In this diagram, red represents the patient health outcome of interest. Data variables in the network map that are close to the outcome (“downstream” data) are more important for predicting the outcome than data variables that are further away (“upstream” data). Causal network algorithms are capable of taking a large set of ‘omics data and transforming it into a network map of relationships that identify the most important variables for predicting patient outcomes.
A curse, or a blessing in disguise, the plethora of data creates unique challenges but also a promising path forward for leveraging network models and novel data to advance healthcare.
[1] https://www.nature.com/articles/s41746-019-0081-5
[2] https://www.nature.com/articles/nature04727
[3] https://stm.sciencemag.org/content/3/87/87ec90