Striving to effectively communicate thoughts and ideas has been an aim of humans since the dawn of time. The Cro-Magnons used charcoal to scrawl paintings on cave walls 40,000 years ago. Egyptians used hieroglyphics and the Chinese created logograms to represent words. In more modern times, organizers of the 1964 Tokyo Olympic games used symbols for sports for the first time to better communicate with an international audience.
Throughout history, the goal has always been to find the best ways to communicate. Inevitably, the solution has been the same: a picture is worth a thousand words. Visualization has always helped drive meaning and broaden understanding.
Making sense of the newly available big data sets and creating actionable insights from them can be challenging – especially when working with the complex data coming from healthcare. It’s crucial to use all available data when trying to create a holistic picture of human biology and behavior, but within the hundreds of thousands of columns and rows, and millions of individual data points, the end goal of better patient care can seem daunting.
Data scientists are beginning to leverage AI to crunch vast amounts of data, generating insights for research, development, and patient care that were unimaginable only a few years ago. But these breakthrough discoveries can often be trapped within the confines of databases, spreadsheets, and statistical models. In order to make the data come alive for a variety of stakeholders, we must convert them into something that is easily understood – which is where data visualization comes in.
What is data visualization?
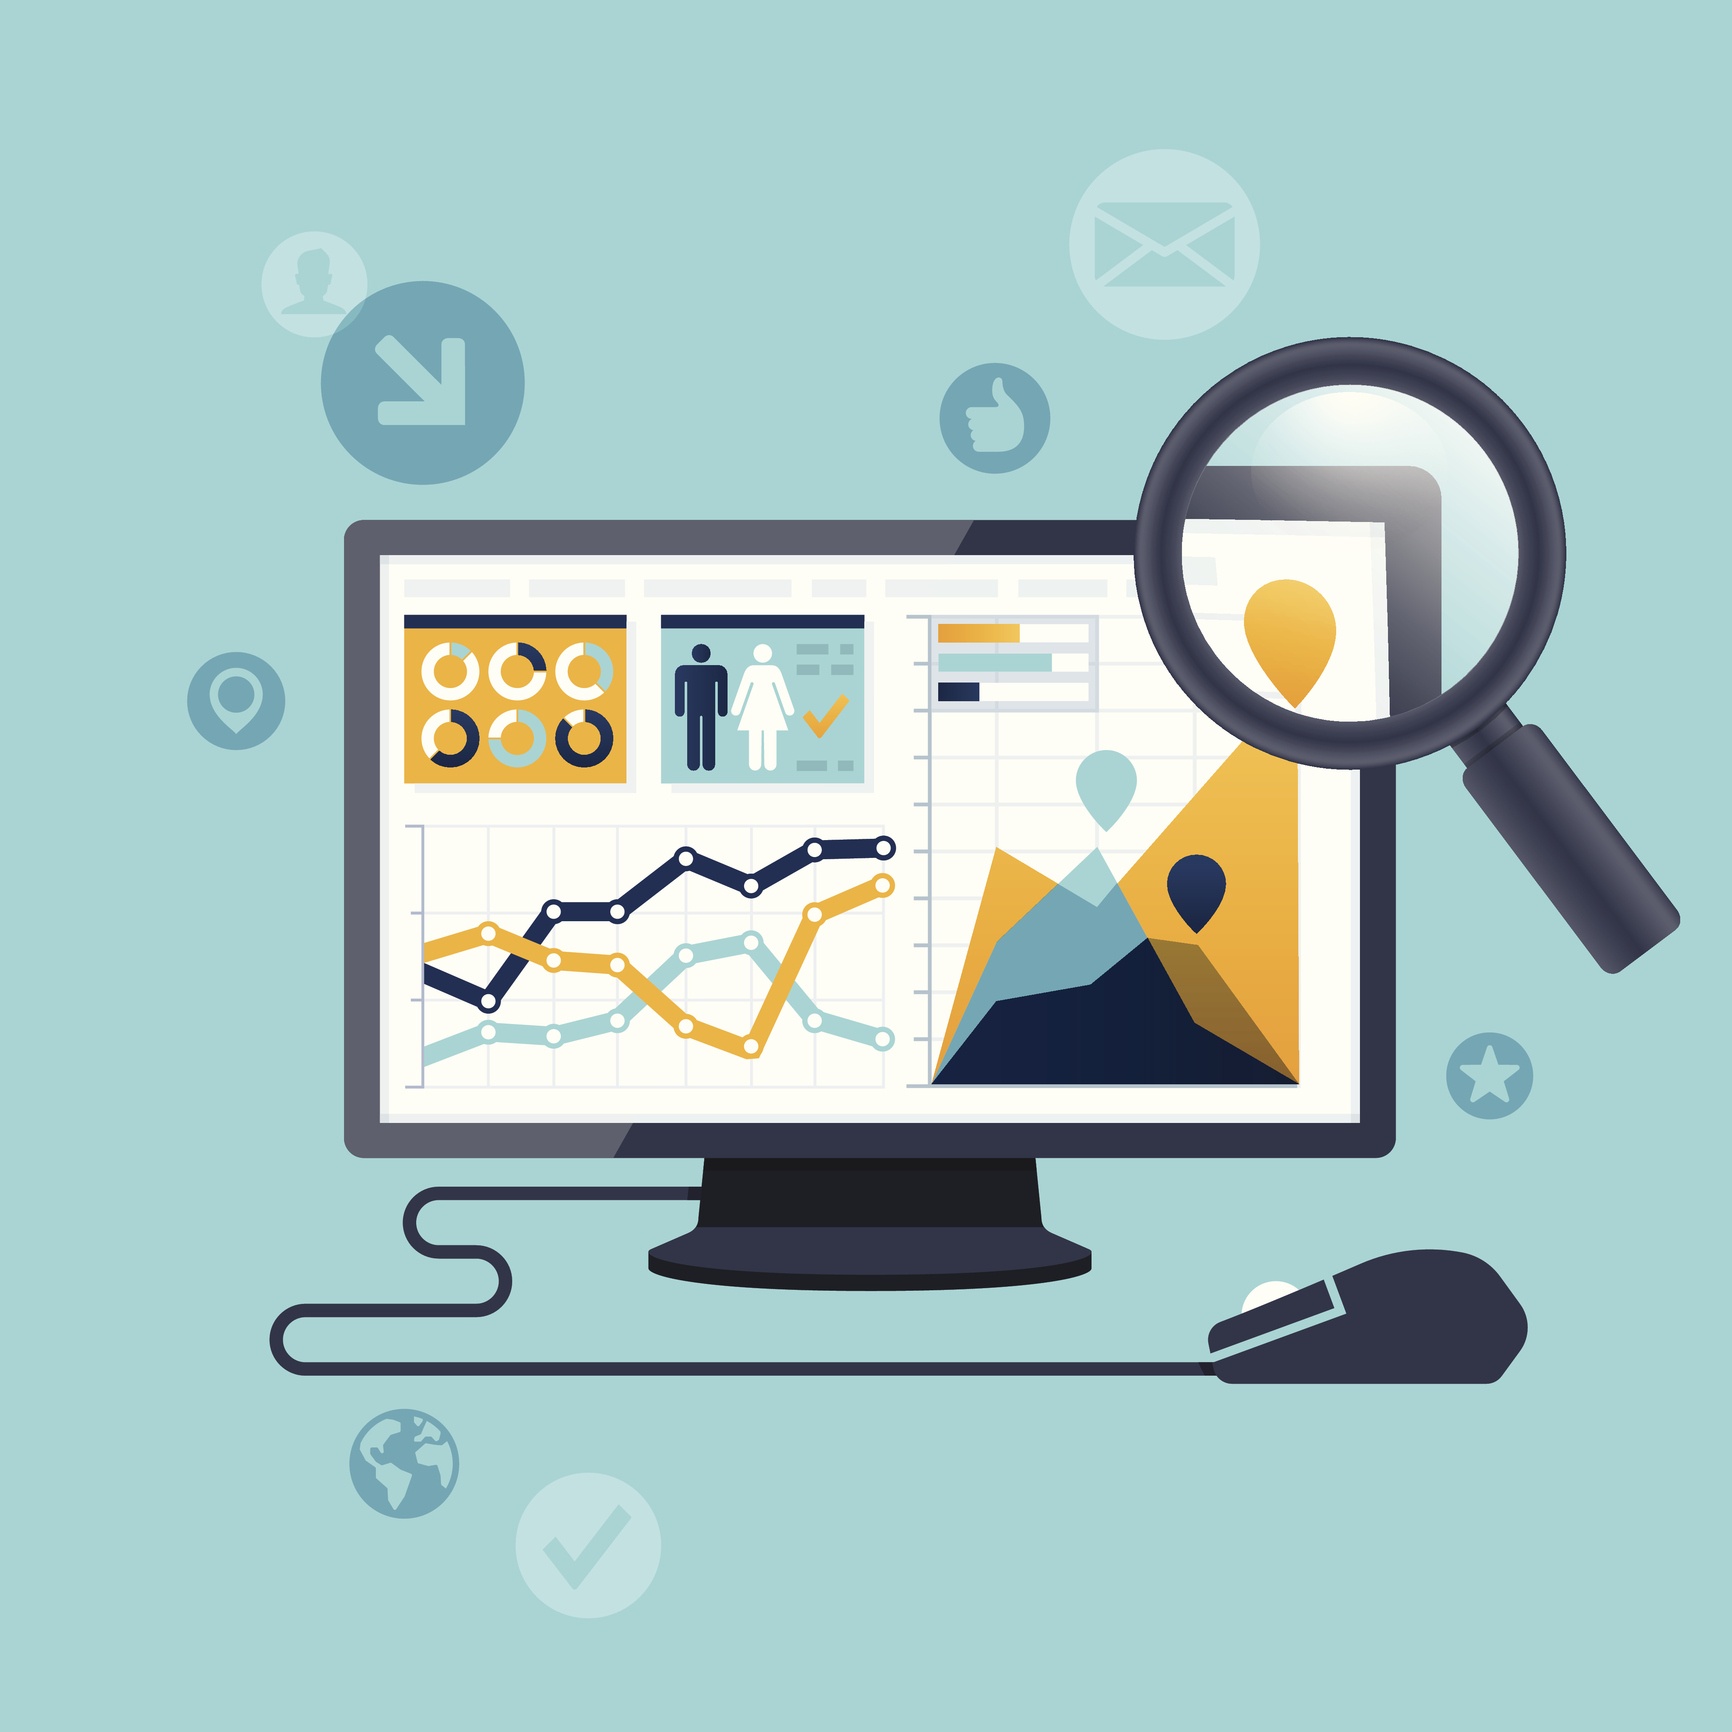
Data visualization is the conversion of massive amounts of raw data into visuals and graphics so that users can better comprehend its meaning. Common examples of data visualization tools include dashboards, scatter plots, infographics, bubble charts, line graphs, and pie charts, but the sky is truly the limit to creative ways that data can be displayed.
Presenting data and information in visual form is particularly effective because it mirrors the way most people think. Consider the following:
- 90% of information transmitted to the brain is visual
- Our eyes can register 36,000 visual messages per hour and our brain can process visuals 60,000x faster than text
- It only takes a 1/4 of a second for the human brain to process and attach meaning to a symbol, compared to six seconds to read 20-25 words
- People can remember the content of 2500 pictures with over 90% accuracy 72 hours after looking at them for only 10 seconds. A year later, people have a 63% recall of the same images¹.
All of this is to say that visualization is a critical component of creating context for complex data that resonates with people much longer than simply providing numbers.
3 Ways Data Visualization is Helping Healthcare’s Transformation
Because of the rapid influx of information coming at us from every direction, it’s important that we carefully consider how to move from data exploration and analysis to data explanation. There are three ways visualization can be a transformative force in this process for healthcare.
1. Encourages engagement and exploration
Looking at data and getting a general idea of what it says is no longer enough. Healthcare leaders need to go beyond the raw numbers and words to understand the larger narrative behind the data. Getting to the explanation side of what the data means is the only way to gain actionable insights and spur additional exploration that can lead to dramatic insights.
The goal of data visualization is to spark engagement and encourage people to ask questions to reach beyond the data itself.One of the key differentiators of causal machine learning is that the methods of generating results are transparent – unlike other forms of AI which provide black box solutions. This transparency must be carried through to the communication of results, and one of the best ways to do that is through data visualization. It is one more way that the discoveries and insights generated can be leveraged to enable real-world applications and improve overall care.
2. Expands the use of data
Data visualization is critical in healthcare because of the volume, variety, and complexity of the data involved. The insights that this treasure trove of data holds should not be limited to to data scientists. Data visualization takes that wealth of information and makes it more real for those who don’t necessarily have a data science background.
AI and causal machine models are using diverse data to generate novel discoveries and insightful results. By transforming the results of data analysis into consumable graphics and images, it ensures that this data can be available and usable to a broader spectrum of users who can leverage it for the greater good.
3. Giving the numbers a human face
Building narratives through data visualization makes the data feel more tangible, more personal, and brings the patient back into focus. With so much emphasis on on digging deeper into data and utilizing technology, it's can be easy to lose sight of what's at stake. The purpose of data visualization is to take facts and figures and remind us that the ultimate goal is more effective and targeted patient care.
Data is a common topic of discussion in healthcare nowadays - from the diversity, to the volume, to the need to share it securely (see our blog post last week). What has not been part of the conversation however is data visualization and how it forms a path back to the patient. But creating the narrative around the various data points allows us to discover the underlying relationships and patterns faster and consume the information more easily. And the closer we get to understanding the patient the better we will be able to deliver the care needed based on his or her unique needs. A worthy goal indeed.
[1] Why Visual Teaching, Visual Teaching Alliance for the Gifted & Talented web site